Price Met Time for Crude Oil
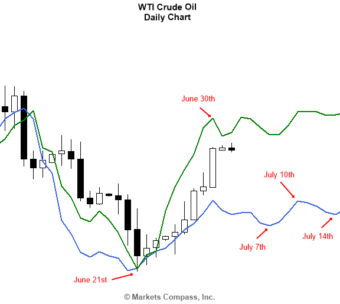
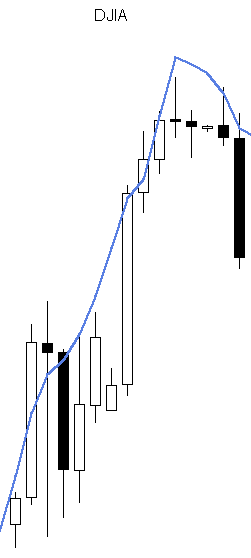
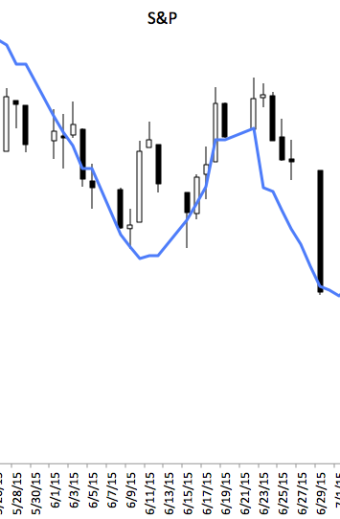
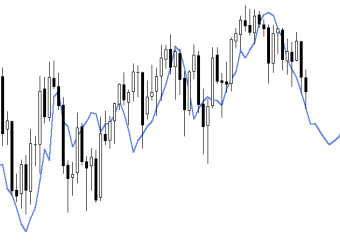
Below is the crude oil forecast that we shared with our clients early last week. And the following are the price levels for WTI crude oil for June 30th that we also shared with them at the same time. In … Read More
The Tides Have Changed
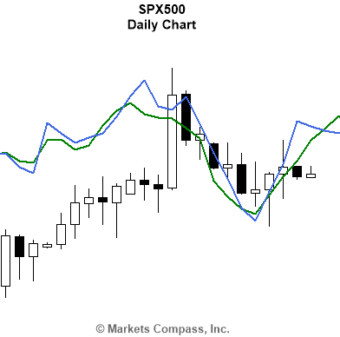
About a month ago, we shared with you the following daily chart of the SPX500 and told you about the importance of the end of February / early March time frame as a key reversal date for equities. US equity … Read More
Is the Rally in Equities Over?
The end of February / early March 2017 timeframe was one of the clear reversal dates for equity markets, and many other markets for that matter, as can be seen in the chart below. However, the million dollar question is: … Read More
Hedging Oil & Gas Production and Shifting Market Dynamics
A couple of days ago, our CEO returned from the S&P Global Platts 4th annual crude oil summit that was held in Dubai, in which he spoke about the importance of hedging production by oil & gas producers (link). The summit was … Read More
Crude Oil Declining into Its Medium-Term Low
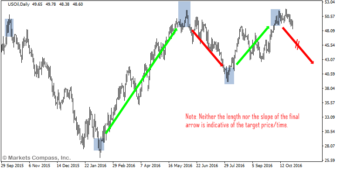
After hitting its swing-high medium-term tension zone that we shared with you at the beginning of this month, crude oil turned lower, commencing its decline into its medium-term low. Below is the early October chart that you have seen before. … Read More
Crude Oil Outlook Update
Click here to download the crude oil outlook update for October 2016 in PDF format. Enjoy!
2310% Returns in Nine Months!
Our performance results were updated on our website today. As of today, our compounded returns since December 2015 stand at a whopping 2,310.3%. For the month of August 2016 and despite the summer doldrums in equities, gold has more than compensated … Read More
Did You See It Coming?!
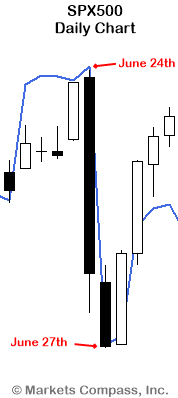
Against all odds and contrary to what most investors and hedge fund managers have “speculated”, our premium subscribers “knew” how exactly the markets were to behave on June 24th, the day the Brexit referendum results were due to be announced. … Read More
Euphoria Subsiding This Week
Equity markets had an amazing rally last week supported by a temporary euphoria caused by a special time pressure window that runs from March 4th – 8th. So, that euphoria will be coming to an end this week! In addition, … Read More
Is It Time to Buy Gold?
In Bloomberg TV’s interview with HSBC’s FX Strategy Head yesterday, HSBC claimed that the gold bear market is over and that it is time for investors to get back into gold. Click here for the link to that interview. I … Read More
The Markets in 2016
In my interview with Reuters for their lead stocks story of the day before the markets opened this morning, I discussed with them my views on the markets, what investors and traders will be keeping an eye on today and … Read More
We Are Up 188% Since December
On December 1st, 2015 we started managing a funded proprietary investment account exclusively based on our enhanced forecasting models and trading and risk management strategies. Below are the returns generated on those holdings from Dec. 1st, 2015 to Jan. 22nd, 2016, net of commissions and fees. Net … Read More
Today Will Be Another Big Reward Day!
Chinese brokers worked for a whole 29 minutes today before the CSI 300’s circuit-breaker halted trading on that market after plunging over 7% for the second time this week! This drop painted most stock markets across the globe in red. … Read More
Time Pressure Points in Action!
Those time pressure points have sure started to wreak havoc in the markets right on time! We in North America woke up this morning to news ranging from North Korea’s H-Bomb test, to further devaluation in the Chinese Yuan, which … Read More
Big Reward Day!
We hope you had an enjoyable New Year holiday with your loved ones and are now back all charged up and set to make 2016 your best year ever! With those thoughts on mind, today should be the big reward day … Read More
Here Is What the Fed’s Decision This Month Will Do to the Markets
Everyone is speculating on how the Fed will move on interest rates this month and most analysts and market participants believe that, especially with this morning’s positive US employment report, that the Fed will almost certainly move to raise rates. However, … Read More
This Is How We Made 145% in Profits in Under a Week
With the tragic events that took place in Paris on Friday Nov. 13th, many were expecting the markets to open lower the following Monday (Nov. 16th) and some top traders and analysts even publicly bet money on that. However, our … Read More
38% Profits in One Week!
Our forecasted market high for last week came in exactly as forecasted and we managed to lock in 38% in profits on our aggressive long position that we opened just a week earlier. Not only that, but the S&P actually … Read More
The Rally Continues!
The US equity markets have rallied impressively over the past few weeks that the S&P turned back positive for the year as of this past week. Below is the SPX500 chart with a portion of our forecast line plotted on … Read More
Second Down-Leg Completed
The US equity markets completed their second corrective down leg on Sep. 4th as per our Master Market Forecast line shown in the chart below. The rebound from that low will not last long, however, as the markets will dip … Read More
Market Deceleration
Today, we would like to discuss with you an interesting phenomenon that we shared with our readers in the free newsletter last month, which is that of market deceleration. Early July, our proprietary software warned us that markets have been decelerating time-wise. Now the … Read More
We Accurately Called Last Week’s Sharp Market Decline!
Our proprietary models that accurately predict market behavior weeks and months in advance have once more helped our premium members safely navigate the sharp decline that the markets saw last week, and which we had accurately predicted weeks in advance … Read More
Sharp Decline Forecasted!
As promised in our previous article, below is the Aug. 2nd premium newsletter with the period of the directionless market turbulence revealed! The newsletter stated that the theoretical end date of this directionless market turbulence period is today, Aug. 16th, … Read More
Market Turbulence
Below is a snapshot of the upper portion of the Aug. 2nd newsletter that went out to our premium subscribers, which discussed, among other things, the details of the turbulence period that the markets are currently going through: The hidden … Read More
When Will the Low in US Equity Markets Come in and What Is the Forecasted Market Turbulence All About?!
Our Premium newsletter that went out this past weekend advised our Premium subscribers with the following: Our models show the US equity markets topping out this weekend (Sunday Aug. 2nd to be exact), which means that the actual top may … Read More
Where Are the Equity Markets Heading Next?
Upon the decline of the US equity markets from their July 20th high, which came in after the lower-low that was formed on July 7th/8th, a number of market “experts” went public proclaiming that the end has come and that … Read More
Do Not Be Fooled by Market Action!
Our forecast for the US equity markets called for a top on July 15th with a secondary peak around July 19th as per the charts below. The DJIA made its top on the 15th whereas the SPX500 made its top … Read More
A Market Top Today?
According to our Master Market Forecast, we are heading towards a top taking place ideally today, as per the daily SPX500 chart below. Regardless of news coming out of Greece, China, Iran, or even a NYSE computer glitch, the markets … Read More
Wild Ride!
Our June 29th post issued the following caution to our readers: A word of caution here. Over the next few days, we will be sailing through some turbulent waters (i.e. choppy markets). So, be very careful with how you position your … Read More
US Equity Markets Tumble, in Line with Our Forecast
As our subscribers have seen in their copies of the master market forecast, this week was forecasted to see the US equity markets dip below the June 9th low, and that is exactly what happened! The markets have been sliding down since … Read More
We Shorted the S&P Yesterday Morning!
We shorted the S&P yesterday morning at 2,125.40 and, since then, the market has done what it is supposed to do, which is drop! Below is a snapshot of the S&P’s chart as of the time this post was prepared, by … Read More
Synchronicity or Causality?!
“Synchronicity” is a concept that was coined by the Swiss psychiatrist Carl Jung to describe events that even though are meaningfully related, do not have any apparent causal relationship among them (i.e. no one event causes another). They are just … Read More
The S&P Versus Time & Price Pressure Points
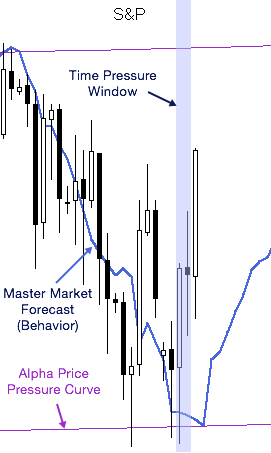
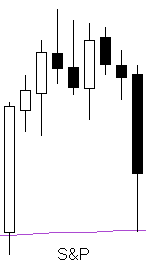
Below is the S&P chart as of yesterday’s close versus its alpha price pressure curve and master market forecast. What is not visible on this chart is a time pressure window that we are in today and tomorrow. Notice how … Read More
Can Market Behavior Be Accurately Predicted Weeks in Advance?!
The answer is YES! It you are a subscriber to the Efficient Market Hypothesis (EMH) however, you may not agree with this answer. To those who are not familiar with EMH, below is one definition according to investopedia.com: An investment … Read More
Time of Confusion? Not for Us!
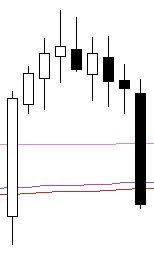
Below is the S&P (futures) chart updated as of yesterday’s close versus its alpha price pressure curve and master market forecast. Our readers were well prepared for the rebound by knowing in advance how the markets were forecasted to behave. … Read More
Are You Prepared for What Will Happen to the Markets Next?!
Below is an updated chart for the S&P with yesterday’s close versus its alpha price pressure curve and master market forecast (with a negative one day phase shift applied to it). As alluded to in our free newsletter that went … Read More
US Markets Follow Our Master Market Forecast
The US markets have continued to do what they are supposed to do, which is to continue to drop, in line with the near term forecast that we shared with you on the weekend. Below is the chart of the … Read More
Market Forecast for the Week of June 8th
We have received a number of inquiries about our proprietary master market forecast, which is one of our key tools that we use in forecasting the markets. So, we have decided to show you how it looks like! Below is … Read More
Entering a Special Time Window!
Watch out! Time-wise, we are treading into a potential confusion window now, where things may not actually be what they look like. During such times, we need to be extra careful with how we perceive the markets! Click here to join our … Read More
Markets Retraced as Forecasted
As our readers were cautioned before the markets opened yesterday, the US markets saw a retracement back up to or near the levels mentioned yesterday. The Dow retraced through the 18,125 – 18,135 price area. The S&P was right on … Read More
Markets Due for a Retracement
After closing below its upper gamma curve on Monday, the Dow went on to test the 17,900 area as we mentioned to our readers yesterday and rebounded nicely from there. If the momentum continues, we may see it test the … Read More
The Dow Closes Below Alpha & Beta
The Dow has closed below its alpha and beta price levels but has not closed below the next key support level around 17,950. If this level is broken, the following support level is around the 17,880-17,900 area. Click here to join our … Read More
Expiring Time & Price!
As we have seen, price pressure curves are formidable levels for markets to reckon with on their own and so are time pressure points. When we put the two together, however, the combination becomes unheard of! More specifically, the meeting of … Read More
Today’s Market Outlook
The Dow, S&P and NASDAQ are still largely restricted by their upper pressure curves for the second day in a row (with the S&P being the only one to manage to close slightly above its curve). This, coupled with the … Read More
Markets Rebound to Close at Their Pressure Curves
The Dow, S&P and NASDAQ all rebounded yesterday to close at or just below their pressure curves, with the NASDAQ making a higher high in contrast to the other two markets. This is consistent with the inter-market divergence theme discussed … Read More
Inter-Market Pressure Curve Divergence
The Dow (according to the futures quotes that we track) closed yesterday below its alpha and beta price pressure curves around 18,070. On an intraday basis, it reached a low of 17,965 in line with the 17,950-18,000 range that we … Read More
Intraday US Markets Update
In preparation for the May 19th/20th market high, our May 18th newsletter advised our readers of the following: We should at least see a (Dow) retest of the now lower gamma level around 18125. At the time of preparing this … Read More
US Markets Turn as Forecasted
It was no surprise for our subscribers to see the US markets turn on May 19th/20th exactly as forecasted and communicated to them last week and early this week. Both the Dow and S&P reached their highs on the 19th; … Read More
Entering New Time Pressure Window!
What used to be the Dow’s upper gamma pressure curve has now become its lower curve and just in time as we enter the new time pressure window around May 19th/20th. This particular time window is typically associated with market … Read More
The Dow Has Finally Broken out of Gamma!
Sure enough, the Dow has finally managed to break out of its current gamma curve and seems to be heading towards new all-time highs! As mentioned in the previous newsletter, the key price target that we have our eyes set … Read More
Will the Dow Finally Break out of Gamma?
Yesterday, the Dow rebounded from key support levels. If it keeps that momentum, it may very well close above the 18125 gamma level soon, which would in turn trigger a bullish stance towards the all-important 18400-18500 level. There will be, … Read More
The Dow & Gamma
After poking through the 18125 gamma level on Friday, the Dow did close above 18060, which is the price level that was mentioned in the previous newsletter. However, since it could not close above the gamma level itself, it was … Read More
The Dow’s Rebound
As mentioned in the previous post, the 17770 price level was a key level for the Dow. A close below it would have triggered lower lows. However, the Dow could not close below it on May 6th and followed up with … Read More
The Markets and The Point of Clarity
Our market insight that we shared with you before the markets opened on Tuesday, May 5th, stated the following: Time-wise, yesterday/today mark an important “Point of Clarity” according to our models. Therefore, we expect the markets to start revealing their … Read More
The Point of Clarity!
Note: below is the email that went out to our subscribers before the markets opened this morning. The Dow is still very well contained within the upper and lower bounds of our pressure curves, as you can see in the daily chart … Read More
Was It a Coincidence?
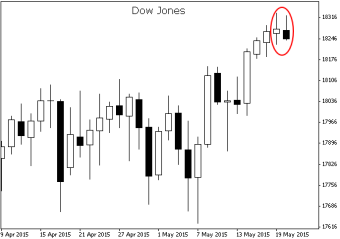
Notice how the lows of the Dow Jones Industrial Average for last Thursday & Friday barely touched our forward-looking pressure curves then instantly rebounded! Was it a coincidence?! If you have been following us for some time, you would know better. You would … Read More
The Dow Today!
Here’s what the Dow did today. It touched our lower pressure curves around the 17700 level then bounced back up to close a bit higher. Lower price targets will come in effect only if the Dow closes below our pressure … Read More
The Market Has Moved As Forecasted!
We are officially short now. Our first target for the Dow of 17700 was hit. If the market closes below it with follow-through, the next two targets are 17500 then 17350. Click here to join our free mailing list for a taste of our … Read More
The Dow, S&P, and Nasdaq
This week’s forecasted market high has produced results in all three stock market indices: the Dow, S&P, and Nasdaq. So far, however, it has been more pronounced in the Nasdaq, as can be seen in the charts. Click here to join our … Read More
Dow High Yesterday!
As expected and communicated to our members regarding a Dow counter-trend action around the April 23rd/24th time frame, the Dow did register a high yesterday and our members were ready for action. Armed with information and ready for the opportunity, … Read More
Dow Update (re-post of the April 24th newsletter)
The Dow yesterday touched the converging alpha & beta upper price pressure curves and closed below them, as you can see below. Overall, the price action for this week has been very well contained within our curves. Time-wise, we are … Read More
Free Content Section
We are glad to announce that we have just launched this section of the web site to share news, information, and some of our work with the public. Hope you find it useful! Click here to join our free mailing list for a taste of our unique … Read More
