The US markets have continued to do what they are supposed to do, which is to continue to drop, in line with the near term forecast that we shared with you on the weekend.
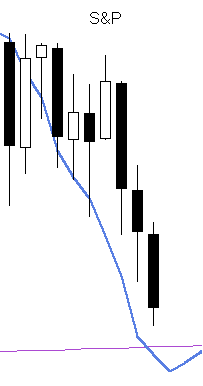
Below is the chart of the S&P as of yesterday’s close with the application of a negative one day phase shift to the original forecast curve, which is in line with the market’s recent behavior. It is typical for markets for experience a phase shift of +/- a few days depending on the phase that it is in.
The one day negative phase shift makes today coincide with the low shown by the forecast, which interestingly enough is just around the S&P’s alpha curve level around 2,073. Could it be that the market will make a rebound today around the alpha level?!
Click here to join our free mailing list for a taste of our unique market insight/foresight. To join our premium newsletter and receive our premium content, send us an email from the “contact us” page here and we will send you the subscription link with all the details.