The end of February / early March 2017 timeframe was one of the clear reversal dates for equity markets, and many other markets for that matter, as can be seen in the chart below.
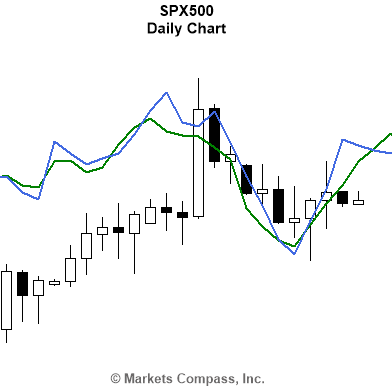
However, the million dollar question is: would that be just a minor correction or a key trend reversal? The answer lies with the Master Market Forecast, part of which you see as the two lines plotted on the chart above. It may be a good time for you to trial our short-term forecasting service (if not a member already), which covers US equities, crude oil, and gold for two weeks free of charge. Click here for more information.