We shorted the S&P yesterday morning at 2,125.40 and, since then, the market has done what it is supposed to do, which is drop!
Below is a snapshot of the S&P’s chart as of the time this post was prepared, by which time the S&P had already lost 15 points.
For our newer readers, the blue line is the master market forecast, which delineates the forecasted behavior for the market, while the purple line is the alpha price pressure curve, which currently sits around 2,104.
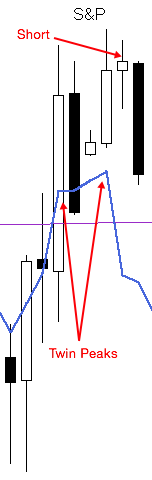
Notice the twin peaks that our forecast said the market should experience on June 18th & 22nd and that the second peak should be slightly higher than the first?! The market obeyed!
All of our readers received a free copy of our quarterly forecast this past weekend, which showed this exact same picture. So, this should not have come as a surprise to anyone on our mailing list. As a matter of fact, everyone on our list should have made very good money by now!
Just one trade pays for the price of the forecast many times over!
Click here to join our free mailing list for a taste of our unique market insight/foresight. To join our premium newsletter and receive our premium content, send us an email from the “contact us” page here and we will send you the subscription link with all the details.