Below is the S&P chart as of yesterday’s close versus its alpha price pressure curve and master market forecast. What is not visible on this chart is a time pressure window that we are in today and tomorrow.
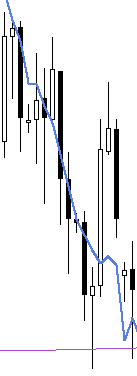
Notice how the S&P has rebounded from its alpha price pressure curve! Could this mean that we are potentially approaching a meeting point of time & price?! The answer lies with the master market forecast!
Click here to join our free mailing list for a taste of our unique market insight/foresight. To join our premium newsletter and receive our premium content, send us an email from the “contact us” page here and we will send you the subscription link with all the details.